CARE
From a patient’s words to clinical context.
Discovery & design lead · Mobile & web · 3 monthsThe symptom cycleReflect
A moment for yourself.
A weekly reflection begins alongside the updates you’ve already shared.
- Headache
- Acne
- Nausea

Reflect, a patient check-in prototype. The recording moves from the reflection history to a guided video recording with the prompt “How are you feeling physically?”, while recognized symptom terms appear: Headache, Acne and Nausea.
Remote monitoring
Between doctor visits, patients in cancer research kept track of their symptoms and treatment side effects every day. I designed the platform for that remote monitoring, from a patient’s own words to the care team’s review.
Product discovery and design lead in AstraZeneca’s digital health oncology division. I interviewed patients, doctors, nurses and research staff, and directed biweekly design sprints, each testing specific hypotheses with users by prototype.
CARE shipped as part of AstraZeneca’s clinical trial technology stack alongside Medidata Rave (ePRO/EDC data capture) and Control Tower (internal trial analytics). Built for early-phase oncology dose-escalation studies, CARE enables study teams to capture and analyze higher-granularity patient ePRO data between clinic visits to better evaluate tolerability and dosing decisions.
Why it matters
Patients report symptoms earlier than clinicians record them.
That’s a finding of Dr. Ethan Basch, CARE’s clinical advisor, who led development of the National Cancer Institute’s patient-reported measure of side effects.
Voice symptom tracking
Patients can track their symptoms just by speaking in plain language.
Reflect
Start with the patient’s own words.
We explored LLM extraction of symptom keywords from a short spoken reflection, alongside PPG sensing that reads blood flow through the skin while the patient speaks.
I designed the interaction around it: permissions, recording prompts, time-limit cues, and the choice to continue, save or delete a reflection.
I specified every state around the patient experience of recording symptoms and side effects.
Permission, interruption, clarification, draft recovery and the recipient’s review.

The symptom journey
From a reflection to the people who follow it.
My user flow for Reflect: record, clarify, share and review, with a way out of every interruption.
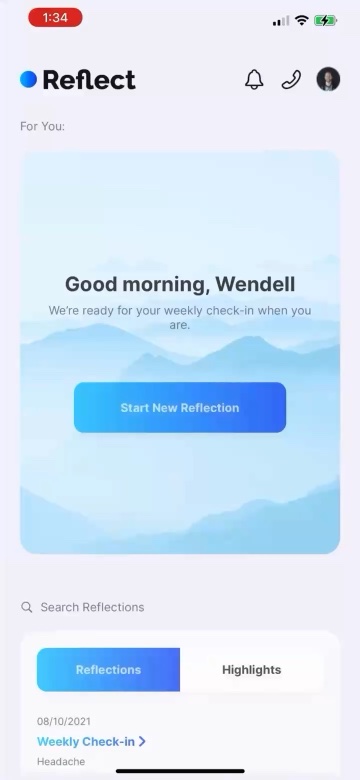 Home
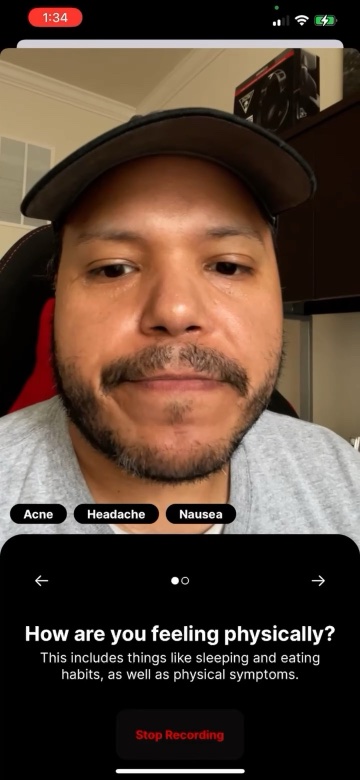 Recording
Steps from my original user flow. Screens are frames of the Reflect prototype recording.
Concept testing
Ideas, tested with patients.
Weekly insights, symptom stories and pain-management content. Each concept was tested to learn which presentations felt most useful and least overwhelming.
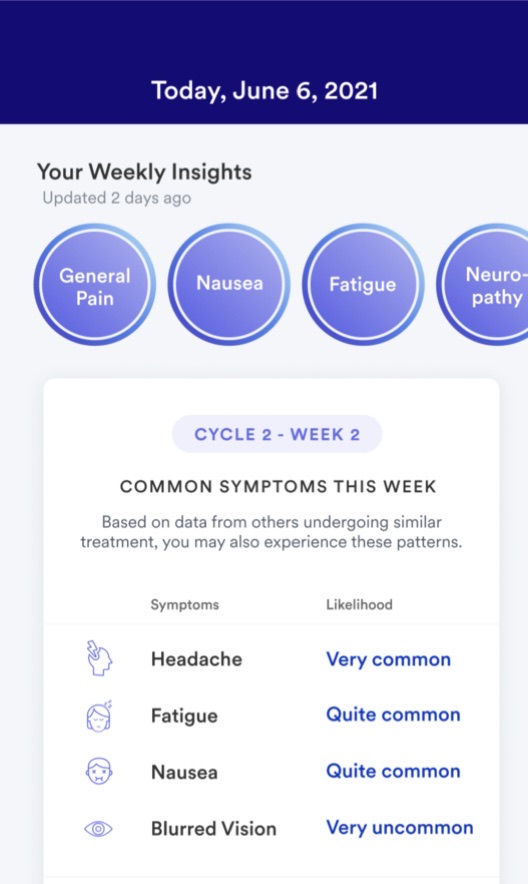
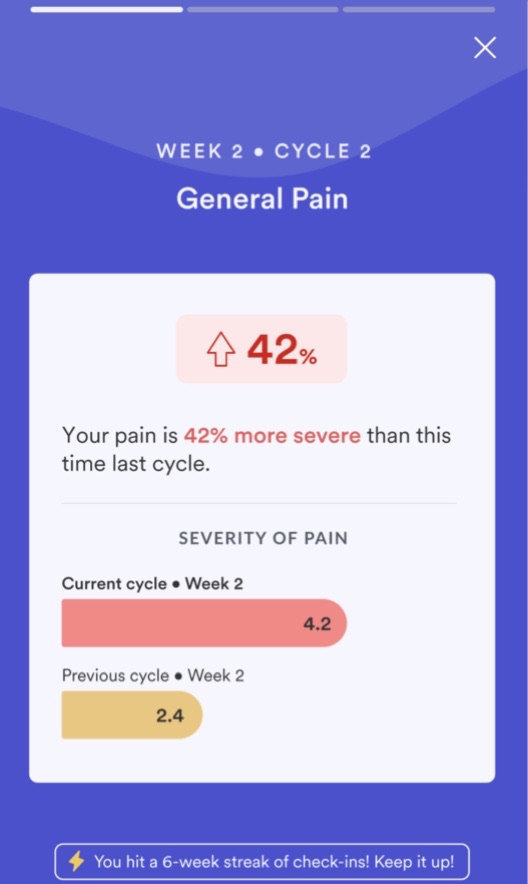
Patient-reported outcomes
Make a symptom history understandable.
The design question was which information helps someone understand their experience without overwhelming them.
- 1
The cycle
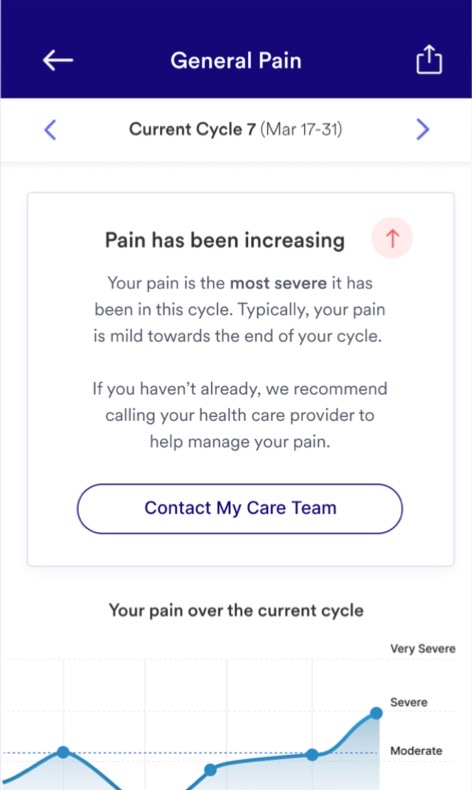
Symptoms read against the patient’s own treatment cycle.
- 2
The pattern
Each report on a five-step severity scale, against the last cycle.
- 3
The next step
A plain language insight, and a direct line to the care team.
Rebuilt in code from my original design. Names, dates and readings are prototype data.
Current Cycle 7 (Mar 17-31)
Pain has been increasing
Your pain is the most severe it has
been in this cycle. Typically, your pain
is mild towards the end of your cycle.
If you haven’t already, we recommend
calling your health care provider to
help manage your pain.
Your pain over the current cycle
Outcome
A specified workflow across patient and clinician.
The flows and annotated states gave the team one account of how a patient update moves from recording to clinical review, including when someone needs to pause or change course.
Credits
- Role
- Product discovery, design leadership, interaction design, user research, design sprints
- Clinical advisor
- Dr. Ethan Basch
- Worked with
- Clinical research team, patients and oncologists, engineering, product management
- Research
- Interviews with patients, doctors, nurses and research staff
- Organization
- AstraZeneca, digital health oncology R&D
- Platform
- Mobile and web, over three months
- Tools
- Figma, FigJam, Miro, Sketch
Screens and recordings are my original prototypes. Names, readings and figures inside them are prototype content, not patient data or results. The evidence figures are published research on ePRO symptom monitoring, not outcomes of CARE.
Research that informed our approach
- Basch et al., 2009
- Adverse symptom event reporting by patients vs clinicians: relationships with clinical outcomes. JNCI 101:1624–1632.
- Basch et al., 2014
- Development of the NCI’s patient-reported outcomes version of the CTCAE (PRO-CTCAE). JNCI 106:dju244.
- Basch et al., 2016
- Symptom monitoring with patient-reported outcomes during routine cancer treatment: a randomized controlled trial. JCO 34:557–565.
- Basch et al., 2017
- Overall survival results of a trial assessing patient-reported outcomes for symptom monitoring during routine cancer treatment. JAMA 318:197–198.